About this episode
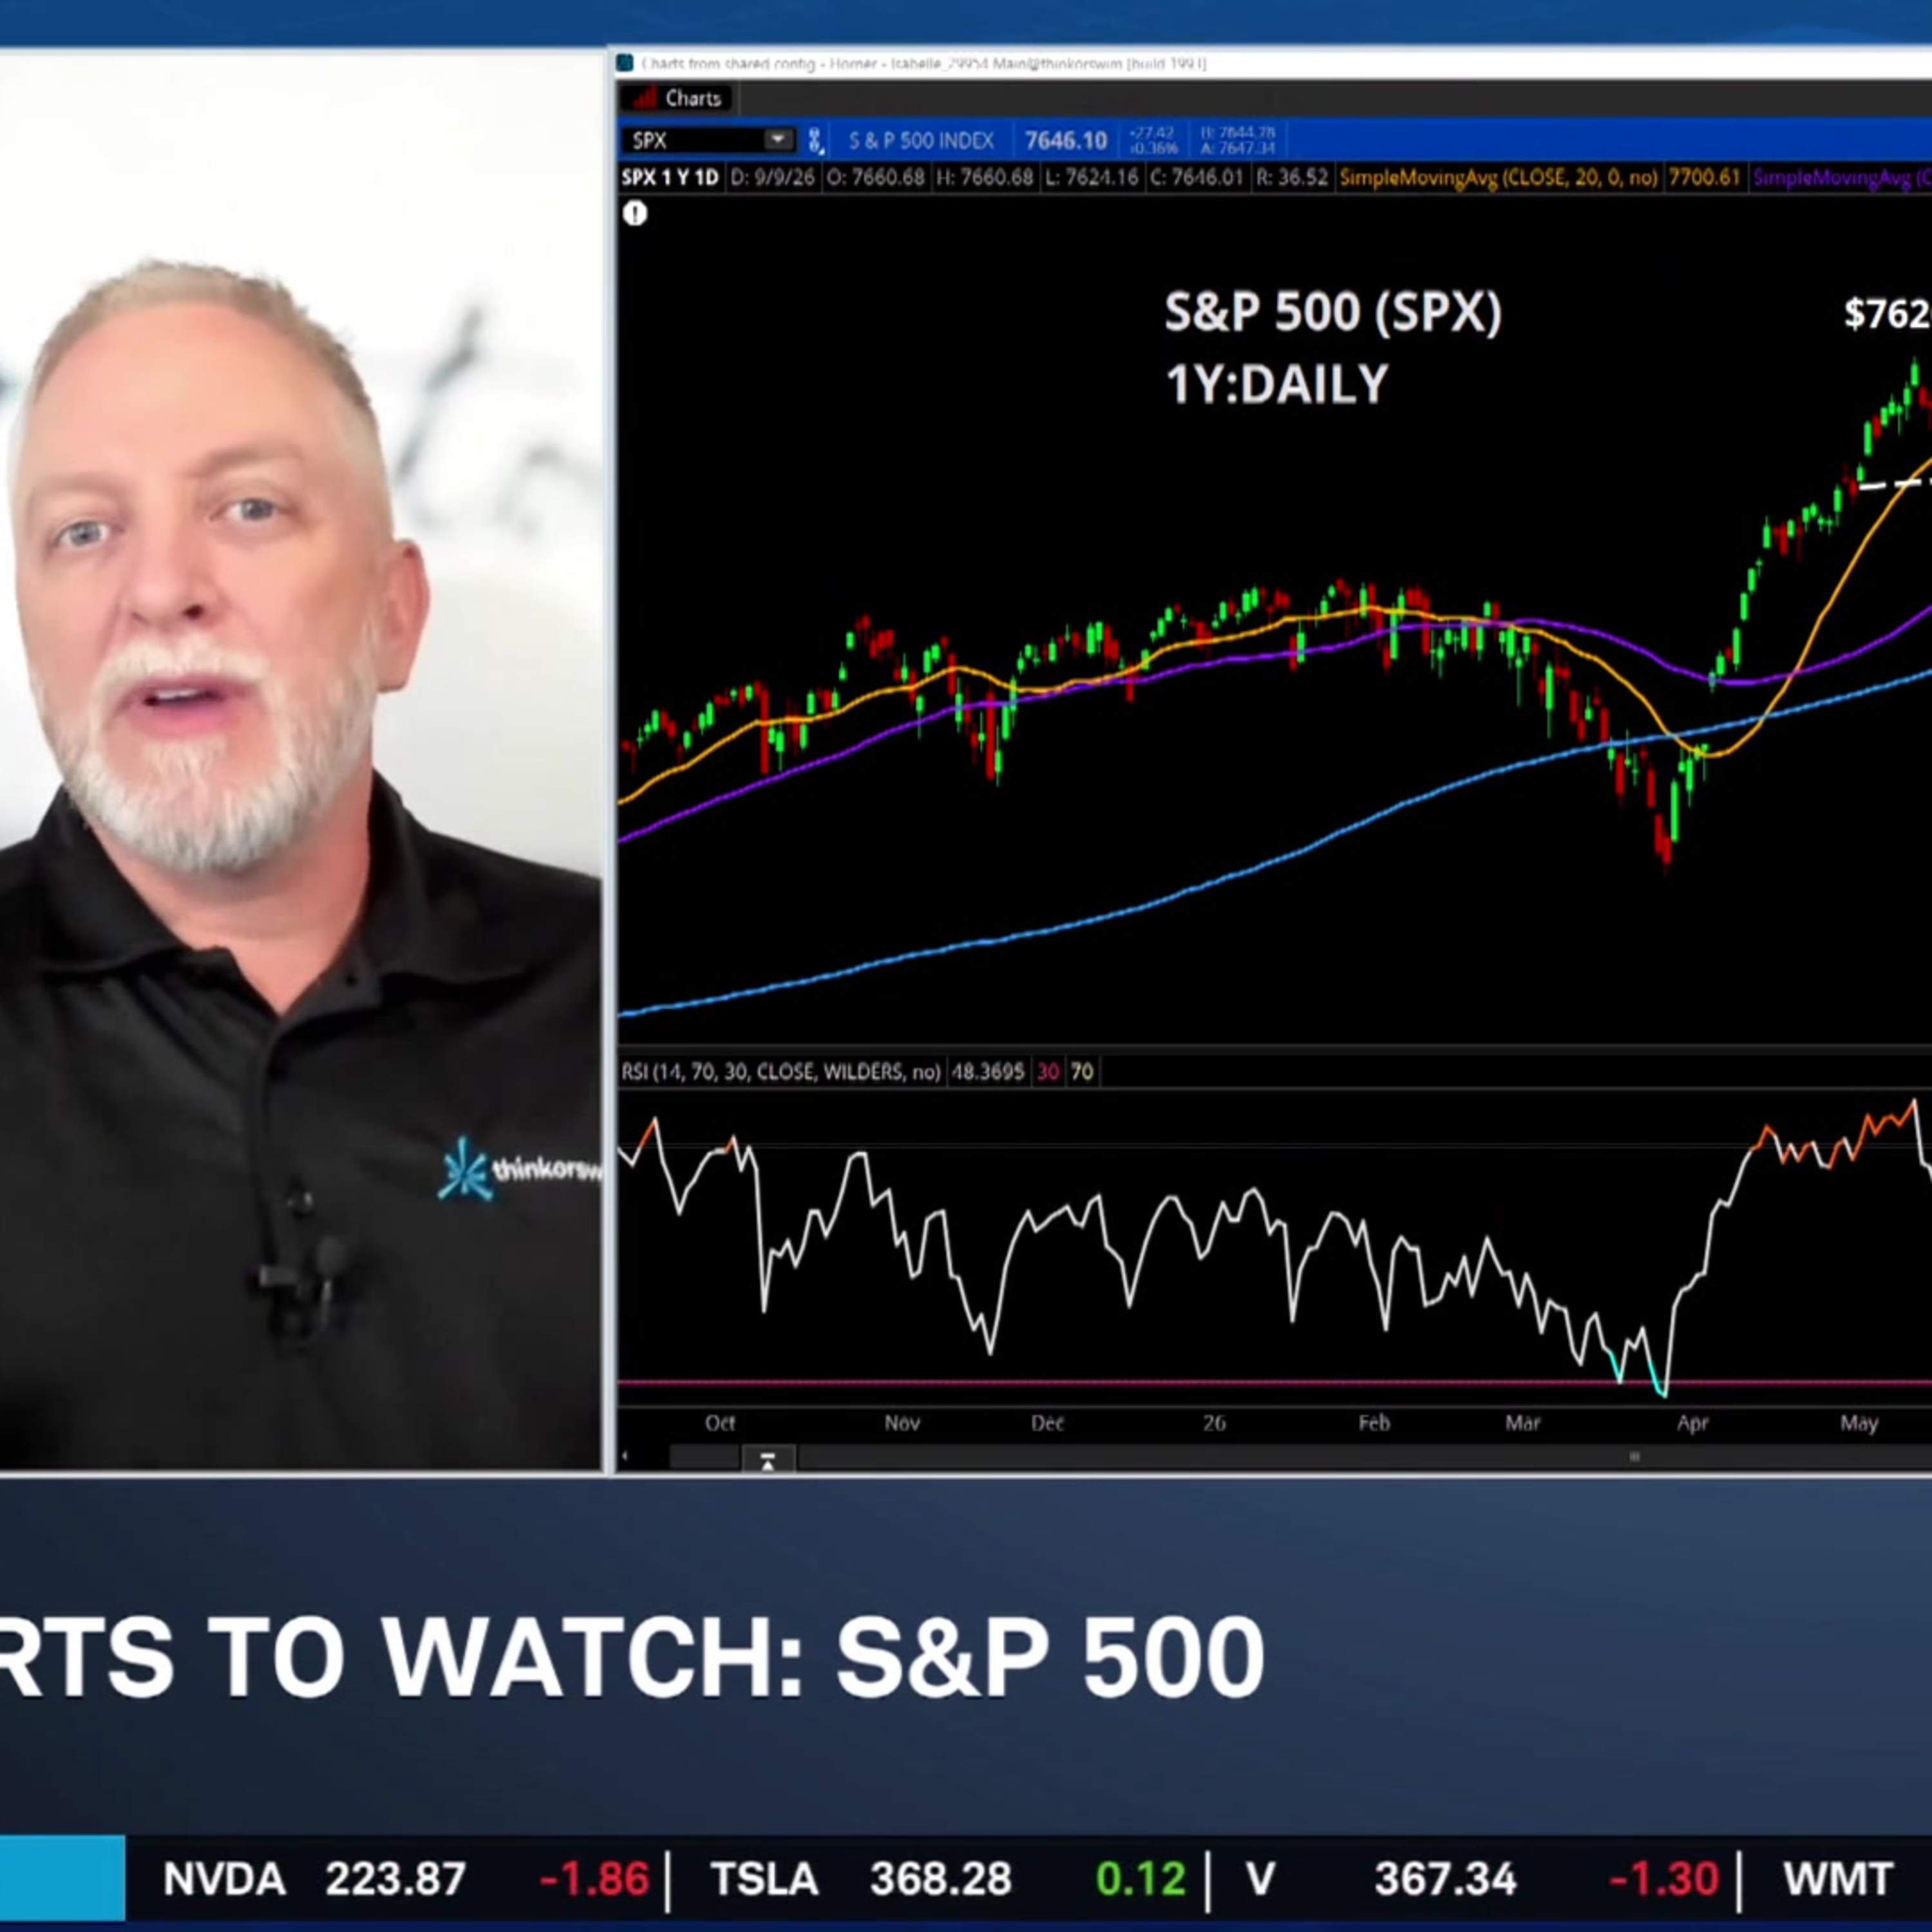
Charles Schwab's Kevin Horner analyzes the S&P 500's (SPX) critical support levels and the risks tied to a sustained break below 7600, then turns to ServiceNow (NOW) and Intel (INTC). He walks through each stock's chart and technical indicators, arguing both present compelling opportunities for bullish investors despite past struggles.
======== Schwab Network ========
Empowering every investor and trader, every market day.
Subscribe to the Market Minute newsletter - https://schwabnetwork.com/subscribe
Download the iOS app - https://apps.apple.com/us/app/schwab-network/id1460719185
Download the Amazon Fire Tv App - https://www.amazon.com/TD-Ameritrade-Network/dp/B07KRD76C7
Watch on Sling - https://watch.sling.com/1/asset/191928615bd8d47686f94682aefaa007/watch
Watch on Vizio - https://www.vizio.com/en/watchfreeplus-explore
Watch on DistroTV - https://www.distro.tv/live/schwab-network/
Follow us on X – https://twitter.com/schwabnetwork
Follow us on Facebook – https://www.facebook.com/schwabnetwork
Follow us on LinkedIn - https://www.linkedin.com/company/schwab-network/
About Schwab Network - https://schwabnetwork.com/about
Get every episode summarized
Each time Schwab Network publishes, we email you a written briefing from the transcript — the topics, who appeared, and any specific claims, with the ad reads skipped.
Email me new episodesFree for 3 shows. No card needed.
Transcript ready
60 searchable segments. Every word is indexed and playable.
Full transcript
Schwab Network — Charts to Watch: SPX, INTC, NOW. Machine-transcribed; use the interactive transcript above to jump the player to any line.
Welcome back to the Watchlist. Time now for charts to watch. Join me, Kevin Horner, Senior Manager, Trading Services, Charles Schwap. We're looking at the S&P 500, third straight, negative day, like the rest of the indices. What are your thoughts? What levels are you watching, Kevin? Well, good afternoon, Nicole. Yeah, it always comes down to whether we're going to break an area of notable support. And we've come into this 7620 zone today, our intraday low falls in at 7624, really close to that prior high. Remember, we hit peak of 7620 back in late May, and we've retreated to test that level. We've really not broken down here, everybody. We've just pulled back the 200 or 150 points, as it were, from the 7800. Watching the 50-day moving average, surely under 7600, under the 50-day, there's going to be some traders who are going to get a little defensive in nature. They might start building cash and SPX positions on a closer to maybe a series of closes under the 7600
and the 50-day moving average, because that would increase the possibility of a deeper pullback. But in the meantime, if and until that does not occur, I guess we can stay, you know, as bullish as we want to be over 7600, we're just going to have to see whether we actually take that level out with any conviction, and obviously we've got plenty of risks that could do that for us, or catalyst perhaps. But for now, I still see 7600, based up to the same level of support we've been talking about in Watchlist hits now for the last couple of weeks. Okay, we know Barclays actually raised their year end target to 7950 today, another level to watch perhaps. Intel, well that's been a winner, it's up to nearly 190 percent in this year, and 330 percent year over year, what stands out in this chart now? You're right, it's had a great year, although the last, you know, two months, not nearly as fun for traders, especially if you were a buyer at the 140 zone that we rallied into, what we've seen recently has been the repair of this chart.
Now the things that stands out to me today, two things notable, one, the 50-day moving average, we've recaptured it, we've held it for two days. We're going to call today a hold, if you will, with an hour to plus, plus to play in the day. But the 10650 level, that's the red line right above us, we've rallied into it, this is our third really, I guess our second challenge of this level for a potential break through it. And if we can get above 10650, 107 or so, then it's going to look like a new short term high, and if that happens, we've got a higher high following a higher low, and that's bullish in nature. We've also got an RSI that's climbing into the mid-60s range, so we're seeing momentum play out here. Don't be surprised if we get thrown back to the, the $100 level, the 50-day moving average, that certainly could happen. And I think there's going to be a number of traders out there who are going to use that 50-day for trend management and trend support. But if this does close over 107 or make a move through 107, don't be surprised
to see a momentum push to the upside rather quickly. Near term, there's a gap ledge that exists from July 7, and that could be up around 117 to 120 approximately. Okay, last but not least, we're looking at service now. One year, it's been a laggard, it's down about 30%, just this month alone down over 10%. What do you see when you see service now? Well, as is off in the case, Nicole, once we go through these big swings with entire groups, and we know that the software space was really beaten down. There's been a lengthy bottoming out, and this is an improving chart for sure. I've got it only on the six-month basis here because the majority of the last two years has been an ugly down trend, but the stock has really done well in the last three to four months. The levels we're watching, 130, we've tested this horizontal support, happens to be coincident, with the 20-day moving average today at around 132. So we are right there with our last trade at
131.90 approximately. Now, the level below that may make sense for a trend manager who wants to give this more wiggle room, so to speak. If we get down and test 118, we should still feel bullish about this maneuver, but a break of that level will change quite a bit of this so-called bullishness. So some levels to monitor. 130, if you're that short-term trader who thinks we can hold the 20-day and push us right back up to into 145. Clearly, moving through 145 is going to be a positive for us if we can get that, but a couple of the takeaways here. One, the moment to move in the RSI was bullish. We got that over the 70 lines, so we've had a validation of this recent short-term high. And then two, the volume that we've been seeing is good and positive, exceeding the 50-day average of volume on our big moves to the upside days, but on the pullbacks we've seen lighter volume. And that's exactly what we want to be seeing from at least raw volume indications.
So some validation of the uptrend that's been in play going back really since mid to late July. And if we just evaluated that move alone to where we're sitting right now, we're up about 40% while we were up as much as 60% off of that July 20 low. So this has been a vastly improving chart in a vastly improving space. And I think this absolutely bears watching for bulls looking to capture a potential opportunity in the beginning phases of what might be an intermediate term, long term intermediate to long term uptrend. Excuse me. Kevin Horner, thank you so much. Always great to see you. Appreciate it. Good look at those names.
More episodes
More from Schwab Network

Stock Market Today: ORCL & ADBE Earnings, AEO Plunges Near 52-Week Low
Schwab Network

Thursday's Final Takeaways: Crude Taps $103 & PPI Hotter than Expected
Schwab Network

Balancing High-Conviction AI With High-Dividend Diversification
Schwab Network

EARNINGS PANEL: ORCL, ADBE
Schwab Network