About this episode
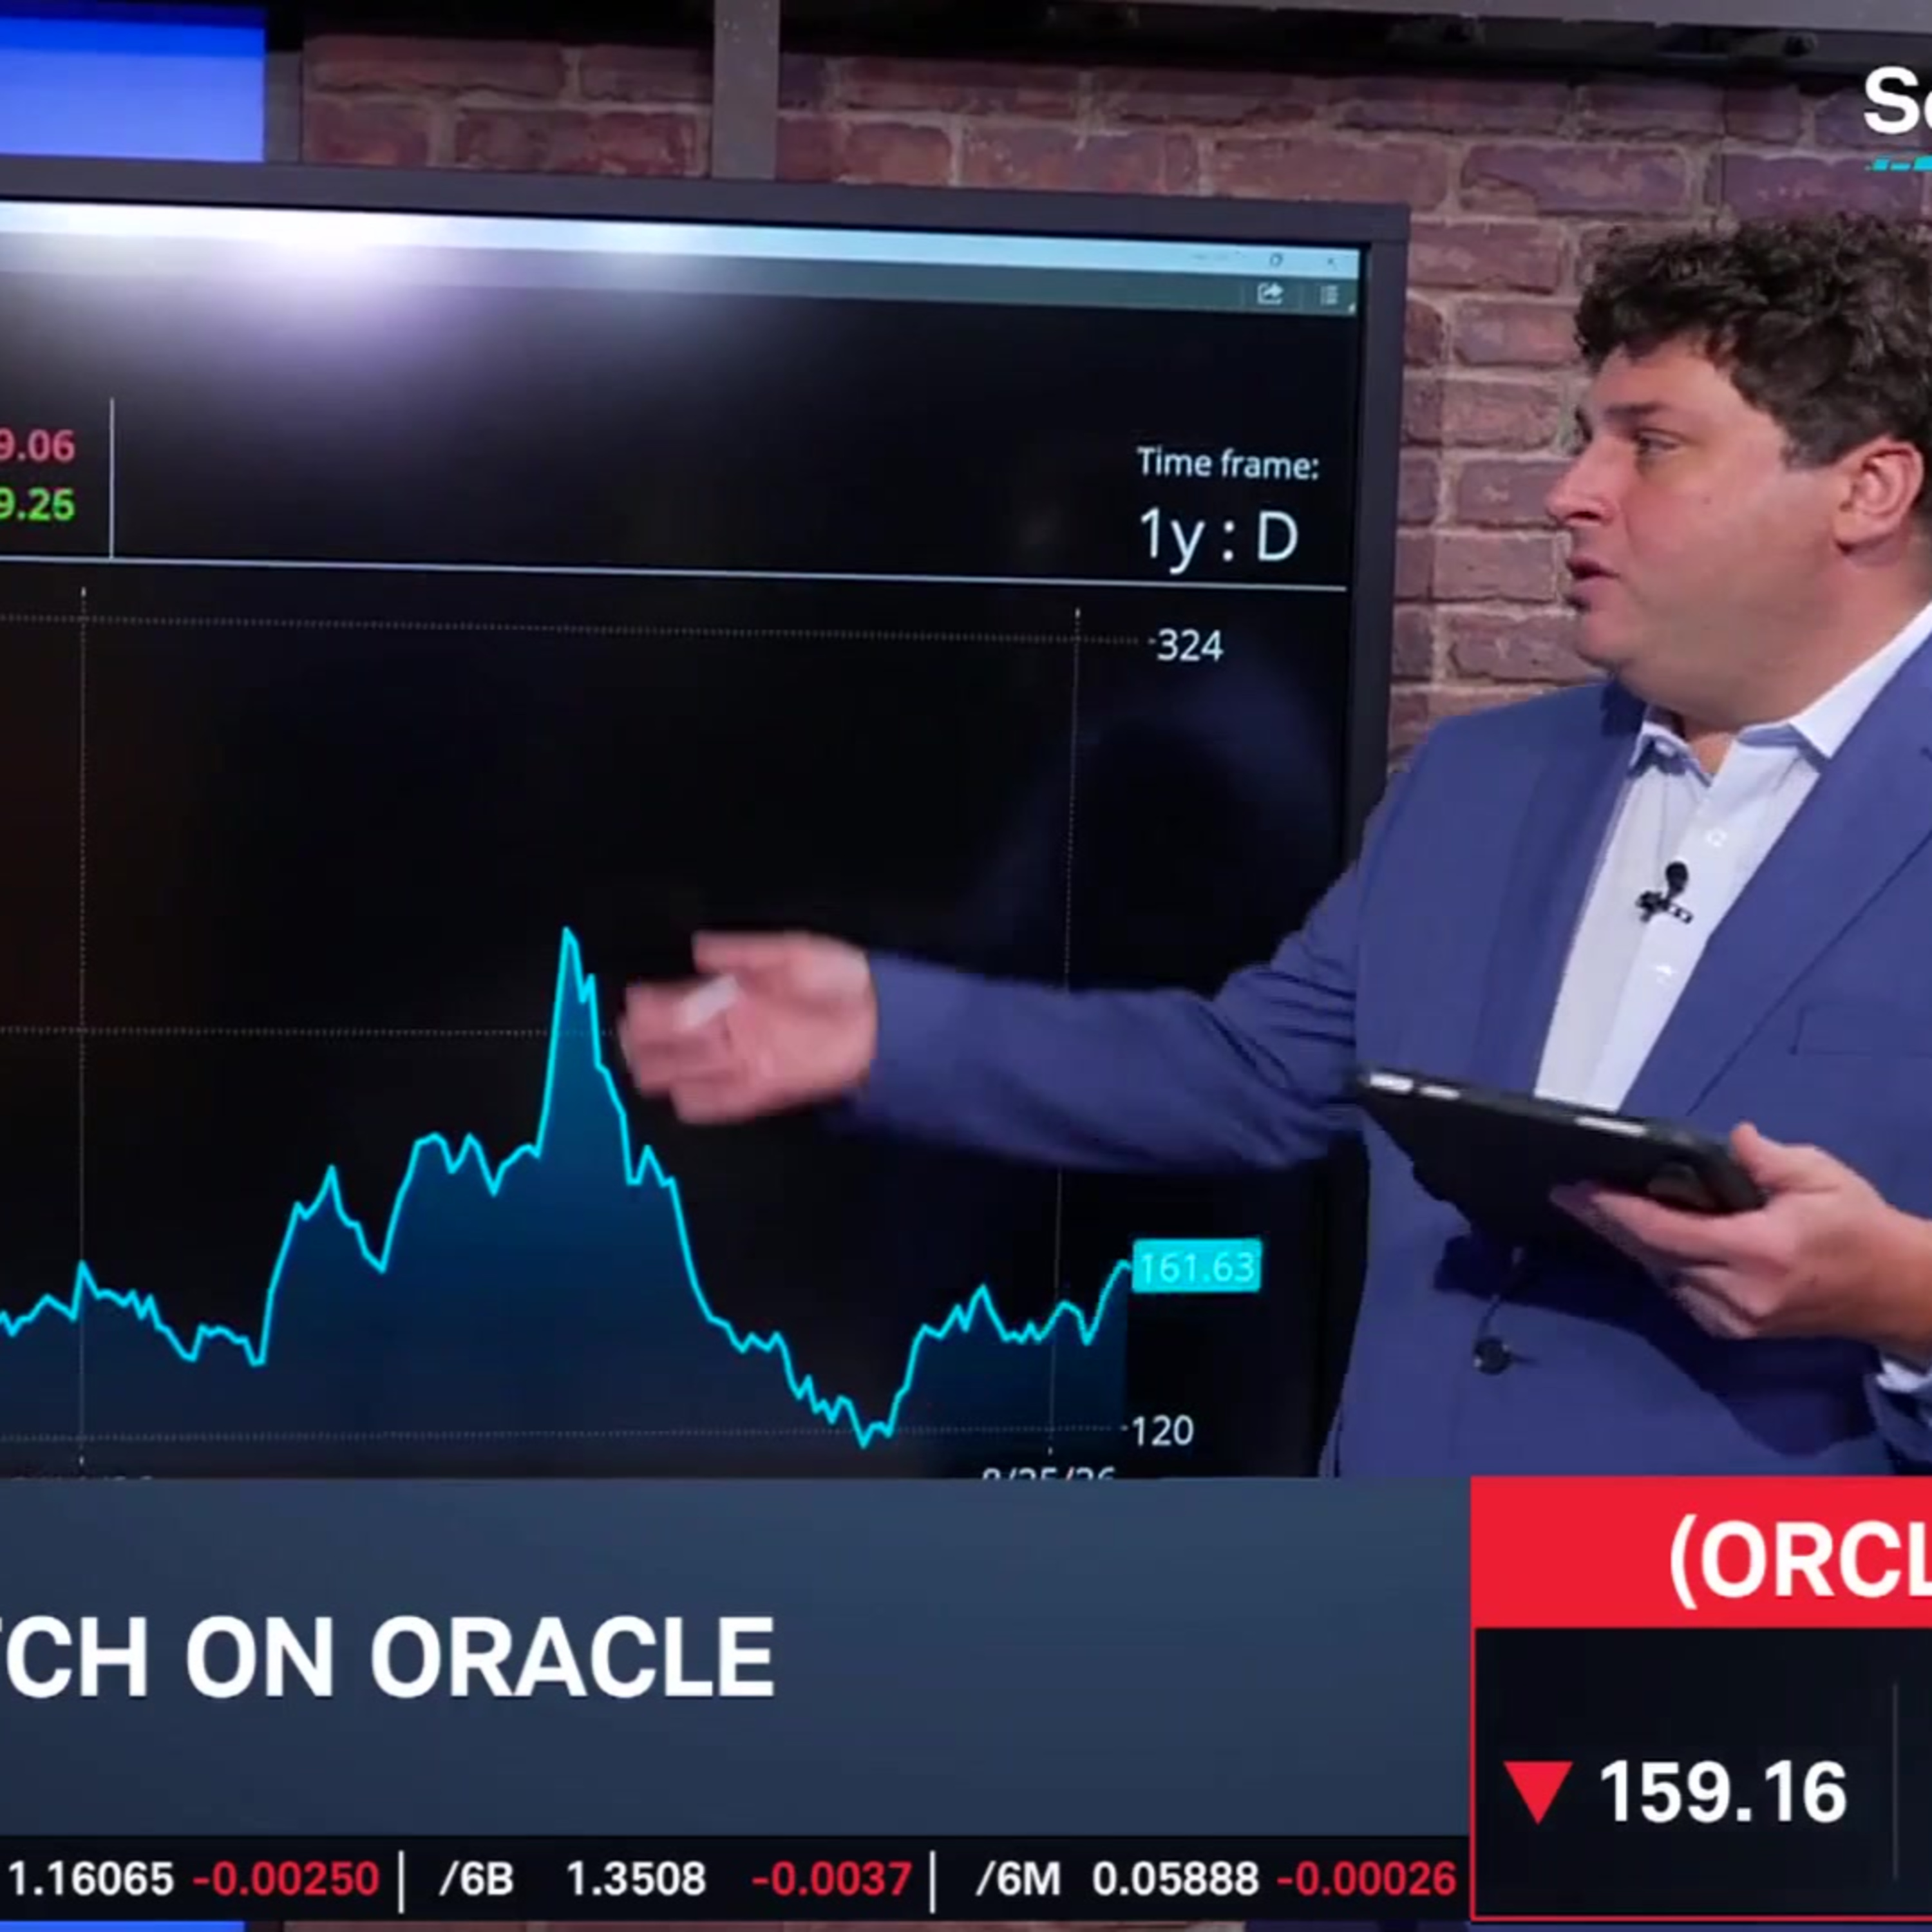
Oracle (ORCL) shares saw a recent pop but remain more than 30% lower year-over-year into the company's next earnings report after Thursday's close. Rick Ducat notes that the company isn't the worst performer in its group, though he highlights levels the stock needs to hit for sustained technical repair. He turns to an example options trade for Oracle.
======== Schwab Network ========
Empowering every investor and trader, every market day.
Options involve risks and are not suitable for all investors. Before trading, read the Options Disclosure Document. http://bit.ly/2v9tH6D
Subscribe to the Market Minute newsletter - https://schwabnetwork.com/subscribe
Download the iOS app - https://apps.apple.com/us/app/schwab-network/id1460719185
Download the Amazon Fire Tv App - https://www.amazon.com/TD-Ameritrade-Network/dp/B07KRD76C7
Watch on Sling - https://watch.sling.com/1/asset/191928615bd8d47686f94682aefaa007/watch
Watch on Vizio - https://www.vizio.com/en/watchfreeplus-explore
Watch on DistroTV - https://www.distro.tv/live/schwab-network/
Follow us on X – https://twitter.com/schwabnetwork
Follow us on Facebook – https://www.facebook.com/schwabnetwork
Follow us on LinkedIn - https://www.linkedin.com/company/schwab-network/
About Schwab Network - https://schwabnetwork.com/about
Get every episode summarized
Each time Schwab Network publishes, we email you a written briefing from the transcript — the topics, who appeared, and any specific claims, with the ad reads skipped.
Email me new episodesFree for 3 shows. No card needed.
Transcript ready
44 searchable segments. Every word is indexed and playable.
Full transcript
Schwab Network — Options Corner: ORCL Seeking Bull Momentum Off Earnings. Machine-transcribed; use the interactive transcript above to jump the player to any line.
Time now for Options Corner. Joining us to take a deep look at the chart is Rick DuCat lead a market technician here on Shwap Network. All right Rick, walk us through the trends we should notice on the chart. Yes, good morning and if you know I always feel sense of emptiness at the end of earning season always kind of say I want to draw us to a close but Oracle you know has been one of the names that was affected by some of this writer software slump here so they have been doing a little bit better than some of the other names in the field most notably into it. We also have Adobe after the close today so this could be a greater read on the software sector in general here but Oracle has had a quite notable decline from those highs that we saw around 325 or so back almost a year ago here. So if we were to look more closely here we can see we've had a significant dip that took us down to these 52-week lows near about 120 years so so from now we have managed to fight our way back up to the 160s or so you could say that we have a upward sloping trajectory here as we head into
earnings but in the broader picture a downward sloping trend would be carrying us throughout most of the year running across these highs so we could think as well if we were to look at Oracle more specifically we can see that we have seen a notable slide after our last earnings event here so Oracle the big question is whether the CAPEX spending that we've been doing in this name can actually catch up to the you know the whether the revenues can catch up to the excessive CAPEX that we've seen here so now we can see that Oracle significantly underperforming the XLK ETF there we can see as well illustrating some of the stuff I was saying about how Oracle is near the bottom of the group here pretty close to into it as well so if we then illustrate some of our horizontal levels we can see here 114.50 that low point repeated floor near about 139 a high near 171 an upward channel type shape here is what we have
seen for our prevailing price pattern our moving averages that we follow show that we are close to our 251 day EMA near 173 we have a confluence of our other moving averages just below us here they're all kind of lumped together in the low 150 high 140 areas all right what's the approach you would take for an example tray right right so if we were to think as well about our expected move boundaries here looking out to November we can see this blue box here plus or minus about 23.6% lining up pretty closely with this gap in those subsequent highs near about 200 or so so this trading question plus one November 20th 160 185 200 call butterfly at a five dollar debit here a bullish trade 71 days out max losses are debit paid 500 dollars max profit if we were to expire at 180 2000 so roughly one to four in terms of risk to reward if we were to exceed
200 we will keep a credit of five hundred dollars in this example trade here break even 165 3.1% to the upside easily within that expected move boundary to the the upper range here if we were to hit that upper area of 200 that's right around the edge of that expected move here so this unbalanced butterfly type of trade would help us prevent a winner from turning into a loser if we do overshoot to the bullish side all right thank you Rick appreciate that that's an example trade there for Oracle
More episodes
More from Schwab Network

Stock Market Today: ORCL & ADBE Earnings, AEO Plunges Near 52-Week Low
Schwab Network

Thursday's Final Takeaways: Crude Taps $103 & PPI Hotter than Expected
Schwab Network

Balancing High-Conviction AI With High-Dividend Diversification
Schwab Network

EARNINGS PANEL: ORCL, ADBE
Schwab Network