About this episode
Mounting macro pressures are what Jason Brown sees hitting the stock market for the foreseeable future. That said, he points to trading opportunities in stocks he expects to weather through volatility. Jason offers example options trades in CF Industries (CF), Lululemon (LULU), and UPS Inc. (UPS). Rick takes investors through his technical analysis for all three stocks.
======== Schwab Network ========
Empowering every investor and trader, every market day.
Options involve risks and are not suitable for all investors. Before trading, read the Options Disclosure Document. http://bit.ly/2v9tH6D
Subscribe to the Market Minute newsletter - https://schwabnetwork.com/subscribe
Download the iOS app - https://apps.apple.com/us/app/schwab-network/id1460719185
Download the Amazon Fire Tv App - https://www.amazon.com/TD-Ameritrade-Network/dp/B07KRD76C7
Watch on Sling - https://watch.sling.com/1/asset/191928615bd8d47686f94682aefaa007/watch
Watch on Vizio - https://www.vizio.com/en/watchfreeplus-explore
Watch on DistroTV - https://www.distro.tv/live/schwab-network/
Follow us on X – https://twitter.com/schwabnetwork
Follow us on Facebook – https://www.facebook.com/schwabnetwork
Follow us on LinkedIn - https://www.linkedin.com/company/schwab-network/
About Schwab Network - https://schwabnetwork.com/about
Get every episode summarized
Each time Schwab Network publishes, we email you a written briefing from the transcript — the topics, who appeared, and any specific claims, with the ad reads skipped.
Email me new episodesFree for 3 shows. No card needed.
Transcript ready
343 searchable segments. Every word is indexed and playable.
Full transcript
Schwab Network — The Big 3: CF, LULU, UPS. Machine-transcribed; use the interactive transcript above to jump the player to any line.
Welcome back to trading 360. I'm Merle Caden. It's time for the big three. We've got three stocks, three charts and three trades for you. Rick, do count will take us through the charts here to take us through the trades today. Jason Brown stock market expert at the Brown report.com and author of five year millionaire. Great to have you both on Jason. Let's start with you. We got PPI prices a little higher than expected here. We're certainly seeing a reaction. I read a 10 year of 491 at the top of the show. And then let's add in oil that's now over $100 a barrel, whether you're looking at WTI or Brent. Yeah, Marley, good to see you. Rick, good to see you as well. The S&P is just having a hard time going higher. And the last time I was on I was bearish on the overall market, but we got a little bit of a spike up. But this action that we're seeing right now, we took out that bit candle in August and like you said, with the 10 years in that 4.9 percent, almost 5 percent.
It's hard for high yielding stocks or so to say high risk high flying stocks to compete with a guaranteed 5% return. And you can take the risk off the table. So I think that's what you're seeing in the market. A lot of stocks are having trouble competing with being able to just park your money in the risk free bond and get 5% guaranteed what I'll take on the new risk. You throw an oil over 100. We still don't have a resolution with the the war in the straight overmoose and oil. This cost can it can only continue to trickle down to the consumer, which you're going to most likely see a slowdown. And then you have the pricing of a potential rate height, not even a whole not a cut, but a potential rate hike. So it makes sense that equities are pulling back or at least stalling at this point. All right, Jason. So let's talk about your first pick in the big three because there is a tie into what you were just talking about there. You've got CF industries here. A fertilizer producer company, which of course is affected by what's happening in
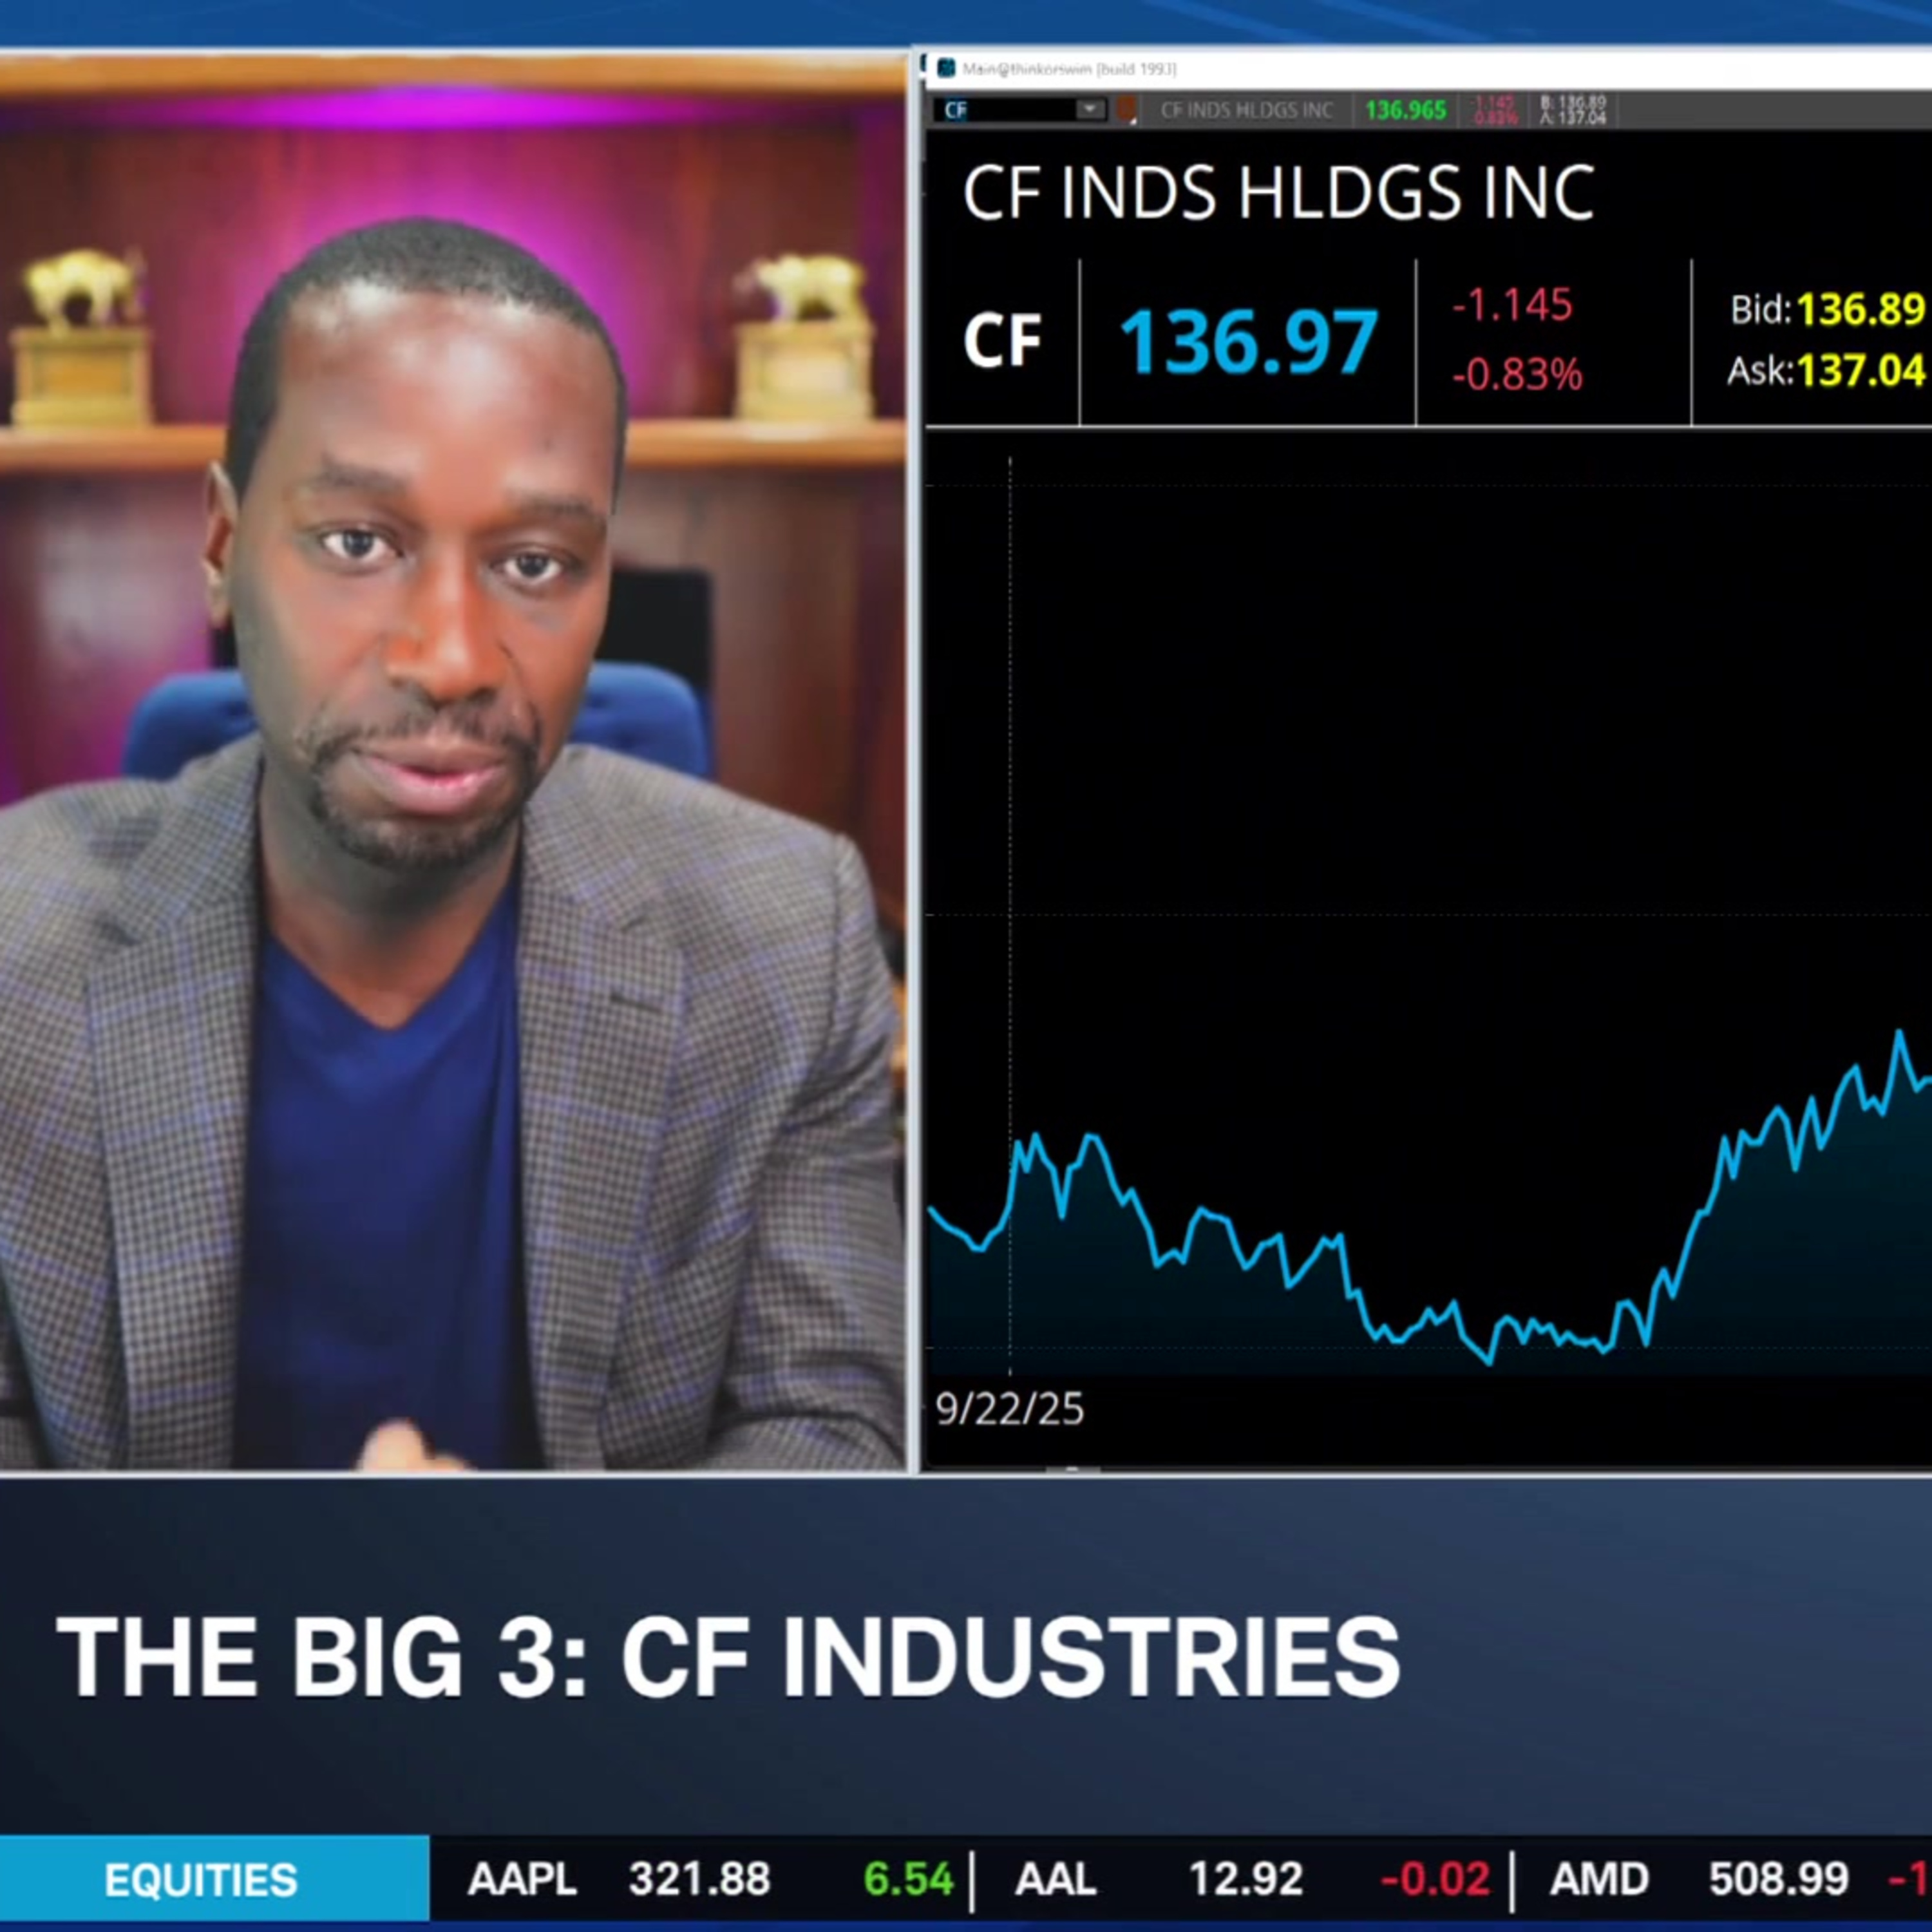
the Middle East. So how are you looking at CF industries? Yeah, so I think this is an interesting stock to pay attention to that a world world's largest producer of nitrogen fertilizer products. And then you mix that with the fact that 25 to 35% of the global traded ammonia and urea comes from the straight of her most. So basically the disruption not only affects oil, but it can affect the supply of fertilizer. When I was digging into the numbers, this is what I found interesting about CF industries. So their Q2 sales were 2.2 billion versus 1.89 billion. So they were up 17% from last year. But what's interesting is their sales volume fell about 15%. So what that tells you is even though they sold less fertilizer or less product, revenue was still up because the cost was able to go up because of the disruption due to the straight of her most. So people still need fertilizer. Farmers still need to grow their crops. But CF was able to charge a little
bit more. So they were able to make up not just make up, but I mean, the revenue just kind of boosted up from 1.9 billion to 2.2 billion, which is huge. That's a lot of money. But here's the thing that's interesting about it. You think, okay, if the straight of her most opens up, oil goes back down and fertilizer isn't disrupted, would that technically be bad news for the company? And I don't think so. I think if they have to lower prices or if they keep prices the same, which seems to be the trend here after COVID, I think that the volume would pick back up and you are offset the fact that they might have to lower prices or if they can keep prices the same and volume picks back up because people are consuming more and farmers are need more fertilizer. I think that means more upside from a revenue standpoint and from a sales volume standpoint from this company potentially. And then technically speaking, I'm looking at an inverse head and shoulders on this stock, a little bit of a cup and handles like a two potentially bullish
signals. The only problem is the stock is kind of trapped at his all time high around 140. I know Rick's going to take a look at the chart. So I want to see if the stock can break above the 140 resistance level. If it can, we possibly can get another leg and run higher on this stock. Yeah, and a very interesting chart here. We saw a lot more volatility near the beginning of the conflict with the war in Iran. But since mid summer, we've seen some pretty strong momentum to the upside here, but as Jason highlighted, we are less than $4 off of those all time highs. So Rick, what are you seeing in the technical setup here? Yes, and petroleum products are a major input in manufacturing fertilizers, while not just that it's an important transport area to like they use the actual physical natural gas and other products. So the $4.196 was the high point date we saw here. That's about where we topped out just recently here today's session as well. We can see that we also had a downward sloping trajectory here off of those highs connecting here that has been broken now in this case. Shortly after
earnings, we bottomed out here near about 110 from there. We formed this channel type shape here trending upward with our two boundary lines here, the bottom line going along the lows, duplicate it, put it across the highs. In this case, it matches up decently well. Today's candle activity is kind of interesting because we have what looks like a bearish engulfing candle shaping up today. So we have a large red candle completely swallowing up the real body, the distance between the opening and the closing of yesterday's smaller green candle here. So if we do get further downside follow through tomorrow, that would be confirmatory for our bearish engulfing candle that could lead to a breakout to the downside below our channel. So we can also see other horizontal levels to watch out for. Old highs here and here and here. That could be then a supportive area near 130. Old highs can frequently become supportive if we do get a downturn. 122, another relative low and finally around 110 are our post earnings
low that we established here at the beginning of our channel. Next we can see our moving averages. We have our five day EMA blue our exponential moving average representing one week. You're about 136 beyond that if we were to break through our channel. We can see our 21 day is around 130 or so a little bit below that level. RSI above the 50 midline below the overbought threshold of 70 green trendline pointing upwards still. So the balls would want to see a further higher close as well as the RSI making a matching new high close. So volume profile in this case is the same as the previous one. So most of our recent trading activity comes in here. 120 to 128 or so. So that could be the supportive area again if we do start to drift lower. All right. Jason let's talk about how you trade this one for example purposes. What are you looking at specifically here? Yeah, so you know the trend is your friend. Stock is moving higher if the cup and handle if the inverse head and shoulders
to be true this stock could be going higher. However it's a little bit if I'm going to take a trade or risk at resistance or potential resistance. I want somebody else to take on a little bit of that risk with me. So I'm bullish the stock. I'm looking at the January 15th 2027 expiration. What I would do is I would buy the 130 strike price call at the time it was going for about $20 and then I would sell the 150 strike price call which at the time was going for about $11. So that brings down your risk from $20. It reduces by $11. So you're only risking $9. If the stock is at or above 150 you're pretty much looking at about a 50% return on your investment here. You're talking about 127 days in time frame which is not bad. But I love having that buffer. I love having somebody else in the trade with me if I have to wait it out that time portion is passed off to them. And then obviously if we get a little bit of a poor back
I reduce my risk from $20 down to $9 by doing that spread. So that's how I will play this. I would also keep my I'm wrong level for a break below the 20 day movement average right now. It's been pulling back and bouncing and the medium the short term off that 20 day movement average. If it breaks that, we might just want to cut this thing short and take a small loss. All right. So let's move to your next one here because I'm excited to hear how you're looking at Lulu Lemon right now. I mean really struggling investors were really hoping for some strong quarterly results from this company. They did not come. The turnaround isn't happening. They're citing you know more pressure and bad press on social media. They're having inconsistent reactions to their product launches. A lot of issues here but a new CEO in play so there is the potential for strategy change. So how are you looking at Lulu? Lulu is super interesting to me. In fact when I look at how much is falling from I'm thinking of myself. Haka Ma didn't have puts on this thing sooner but you know they're a clothing retailer premium athletic wear company
and you got to think about it and this economy is premium athletic wear. The number one thing you're thinking about when gas prices high food prices high everyone's charging you at 3% to use your credit card. I shouldn't say everyone but it feels like that are you really top of mind thinking about athletic wear premium athletic wear. The second thing is you also have competition coming from from other companies. Allo is starting to gang ground and other leisure wear companies and then the third thing you have to ask yourself is where is the growth going to come from? Because how many pairs of nice yoga pants or nice workout gear do you really need? And so I don't understand. I don't know that I see where the growth is going to come from which is why the stock has been in the dot decline. They did get a new CEO I think it's kind of funny that the new CEO is the prettiest Nike executive and Nike is having one of the worst years with this stock that has had a long time. The stock is down in the toilet you know that's the best way to put it
and they're risking getting de-listed from the S&P 500. So no disrespect to the new CEO but that doesn't give me a lot of faith in the turnaround story here and then when you look at the numbers the numbers tell the story Q2 revenue fell 4% comparable sales fell 9% and then when you look at the Americas revenue declined 8% and then comparable sales fell 12%. I know that's a lot of numbers but all I want you to understand is they're going in the wrong direction all the numbers say fail fail fail and then their Q2 margin rose 200 basis point that was from a tear of refund not from the ordinary business doing well so this stock just doesn't get my faith as far as a turnaround story is in the near term. I think it's going to stay flat or even go lower Yalulu is the 10th worst performer in the S&P 500 so far this year. Nike also one of the worst performers and as you highlighted remove from the S&P 100
so as we look at this set I mean you can just see the decline here I mean we're down more than 50% year to date but I do see two converging lines Rick so walk me through what you're seeing here in the technicals Yeah you know notice respect man either but Nike to Lulu is really out of the frying pan into the fire a very difficult situation right now increasingly a lack of loyalty among consumers as well particularly younger consumers but what we can see with our two lines was this symmetrical triangle shape that we saw before earnings as I often say these low volatility environments can often be a precursor to high volatility when the breakout eventually happens unfortunately for the bulls it came from the down to the downside in this case your sore gap open at 118 our pre gap low point was this red line right here near about 104 that's our new high that we had after our breakdown our low came in at 97.55 so those are the relevant areas to watch in terms of our extreme price activity moving averages have not quite caught up with our price action yet here
our five day EMA in dark blue comes in at 103.78 RSI moving lower below the 50 midline 30 is the threshold for the oversold area look for a breakdown below that level for potential acceleration to the downside meanwhile our volume profile shows something that is again not really a great piece of news for bulls our point of control our heaviest trading area of all come is that we have fallen below that heavy volume at low levels often is a signifier that an important low point has been reached so this plunge below that level suggests there could be quite a few trap bulls in this area here so beware of any rallies that could result in a selling activity trying to go out of these positions all right Jason you already said that you don't really see any catalyst to move this name higher so I'm guessing your strategy is bearish but walk us through your trade type absolutely so the strategy is bearish but this is where you have to be careful as the options trade or as a trade or period
you don't want to just pile into the bear side because the stock has been beaten down so much and then we have this huge gap down over earnings so I think the wrong thing to do is just say I just think it can go along go straight for puts I think the right lens to put on it is just to say I don't believe it can go higher and because I don't believe it can go higher and even if it does it would have to chew through all of the that resistance of the gap down I'm looking at this as a bear cause bridge so I'm looking at the November 2026 buy in the 130 strike price out of the money and then sell in the 120 strike price call option which is closer to the money you're selling that for 205 you can pick up the one 30 for 105 so you get the net credit of about a dollar at least you are before the market open so when you think about it you have a good 20 points to the upside that the stock would have to go to before your option is even in trouble in the next 71 days which I don't see that happening and then you're putting $10 at risk to make $1 so you're looking at a potential 10% return in 71 days
I like that trade it has built in a cushion of 20 points if the stock stays the same goes up a little bit or goes down you got three ways to win I think it's the perfect way to use options additionally obviously if we break above the 50 day movement average that would be my arm wrong level but again I don't see it doing it it have to chew through all that resistance that it fell from the most recent earnings Yeah Lulu is down another 1.7% to just above $98 right now your last pick I'm excited to hear about to its UPS we've seen UPS just lose momentum over the last month they're down it's brought them pretty much flat year to date because of this decline so what's your thesis on UPS? Yeah I framed this as asking the question is the market telling us something that management isn't because management is saying that everything is great you know Q2 revenue was up 7.6% year over year we raised full of guidance management said that the restructuring is behind them and that they're entering the second half with momentum
but on paying attention to the stock chart and the stock chart isn't necessarily excited about those words if you think about the business that they're in and what's going on behind the scenes you know they're winding down their relationship with their biggest customer which is Amazon so I think investors are questioning what happens when one of the biggest package shippers in America increasingly becomes its own delivery competitor because now Amazon is delivering I believe the number don't quote me I believe it's something like they're delivering about 85% of their own package or they expected the liver 85 to 91% of their own packages by 2029 so I mean they're increasingly taking delivery into their own hands then you have to factor in the diesel hitter record high of 5.85 cents a gallon almost $6 a gallon and so that doesn't help a business whose business is having trucks on the road and flying airplanes to deliver packages and you really have to ask yourself is there another reason for e-commerce or deliveries or packages to boom
if you've lost your biggest e-commerce client which is Amazon and you're winding it down so what is going to help packages and delivery pick up I don't know that we have an answer for that and I think that's what you're seeing in the stock you also have a double top that happened around the 118 area but more importantly the stock is just broken down below the 200 day moving averages all the moving averages are crossing down it's just not looking good technically and I also don't have a fundamental story or a business story to say this is why shipping and packages are going to increase for these guys here's who they're going to pick up that's going to be the next Amazon to turn it around so I don't I don't see let me put it like this right now they're cutting costs to make their numbers so there's only so much cost that you can cut and then you have to pick up new business I don't see where the new business is going to come from All right Rick so as we look at the technicals here for you PS you can see that loss of momentum that I was highlighting after they had
their stronger earnings report and said that the second half of the year was looking bright for them but as Jason highlighted maybe the market knows something management isn't telling us. Yes perhaps trending lower here important horizontal levels 112 is the earnings gap beginning 109 is the post gap highs and then another high point here near 107 recent lows at 99 and then also a double bottom here near about 94 to think about our moving averages our five days the closest 100.85 is where we can see that one registering right now a slip below our green trend line on the RSI as well is putting us rather close to the oversold area once more now we can also see our volume profile gives us our point of control at 96.45 so that could be a significant supportive area to watch out for. All right Jason then how would we approach trading UPS? Once again options are going to be your friend this is where advanced options strategies are on your side.
I would look at this as doing a bare cost spread again I don't want to count UPS out but I just don't see much reason for it to go higher not necessarily it's going to go lower I just don't see much reason for it to go higher and so I'm looking at a short time I want to say short time 36 days to October 16th 2026 105 strike price call you want to sell that one obviously you want to be covered so you want to go 10 points out and by the 15 strike price call you were getting about a 95 cent credit for that before the market open it might be slightly lower because the stock is up a little bit 75 cents on the day but your break evens at 105 90 so basically for 36 days you put $10 at risk you can make about a 9% return again not much reason that the stock will go higher but even if it does you have a built in $5 cushion which I like so you don't have to be 100% right stock could go up along it doesn't go up too much past $5 stock is say the same or go down you're still going to bring home that 9% return on this trade and obviously my I'm wrong level if the stock breaks above the 200 day moving average you know if for some reason we get a nice
nice bull run you want to shut the trade down take a small loss I still don't see that potentially happening though all right you PS a little higher on the session though right now bucking the overall market trend we're up about 8 10% sitting exactly at $100 a share Jason appreciate you being with us for big three today that's Jason Brown and of course Rick do cat or lead market technician for taking a look at the technicals for us.
More episodes
More from Schwab Network

Stock Market Today: ORCL & ADBE Earnings, AEO Plunges Near 52-Week Low
Schwab Network

Thursday's Final Takeaways: Crude Taps $103 & PPI Hotter than Expected
Schwab Network

Balancing High-Conviction AI With High-Dividend Diversification
Schwab Network

EARNINGS PANEL: ORCL, ADBE
Schwab Network