Loading...
About this Episode
Jason Brown turns to insurance, AI, and retail for today's Big 3 as markets sell off over uncertainty on the U.S.-Iran War. He considers Travelers (TRV) a resilient stock in time of turbulence, doesn't see the rally in Arm Holdings (ARM) lasting, and calls Ross Stores (ROST) as a "necessity" trade with strong technical trends. Jason backs his stances with three example options trade while Kevin Green offers technical analysis of the stock charts.
======== Schwab Network ========
Empowering every investor and trader, every market day.
Options involve risks and are not suitable for all investors. Before trading, read the Options Disclosure Document. http://bit.ly/2v9tH6D
Subscribe to the Market Minute newsletter - https://schwabnetwork.com/subscribe
Download the iOS app - https://apps.apple.com/us/app/schwab-network/id1460719185
Download the Amazon Fire Tv App - https://www.amazon.com/TD-Ameritrade-Network/dp/B07KRD76C7
Watch on Sling - https://watch.sling.com/1/asset/191928615bd8d47686f94682aefaa007/watch
Watch on Vizio - https://www.vizio.com/en/watchfreeplus-explore
Watch on DistroTV - https://www.distro.tv/live/schwab-network/
Follow us on X – https://twitter.com/schwabnetwork
Follow us on Facebook – https://www.facebook.com/schwabnetwork
Follow us on LinkedIn - https://www.linkedin.com/company/schwab-network/
About Schwab Network - https://schwabnetwork.com/about
Hosts & Guests
Transcript
Welcome back to Trading 360. I'm Marley Caden. It's time now for the big three. We've got three stocks, three charts, three trades for you.
Kevin Green will take us through the technicals here to take us through the trades today. Jason Brown from the Brown report.com and the author of five-year millionaire. Great to have you both with us.
Now Jason, my last segment, we had some example trades there as well. So I think we'll just dive right in here with your first one.
You've got travelers company as your first pick here. Take us through this one.
Yes, so good to see you, Marley. Good to see you, Kevin. You know, in the market where we're in the middle of war, there's inflation, there's inflated oil prices.
Sometimes you just need good old blocking and tackling a simple business. And I think that's what travelers companies bring to the table.
They're one of the leading global insurance provider. They're a Dow stock. When you look at the fundamentals, they consistently beat on earnest for share.
Net income was up 10%. You know, if you were a stock holder, they pay out about 1.9 billion in dividends. So that attracts the 401k crowd. That attracts the long-term investment crowd.
But then I also love the technical chart set up here in the stock that attracts the traders. It's been in an uptrend and channel and pattern.
And we're pulling back from the highs of that channel. We've seen consistent bounces around the 200 day moving average.
And so we're not that far above it. So I think when you look at it from an uptrend standpoint, it's when you want to watch and prepare to take an entry as we pull it back potentially to the 200 day moving average.
All right, KG, are you seeing all of this when you look at the technicals for travelers?
Yeah, Jason just did my job here. It has been making a pretty strong uptrend here, especially for a name like this, making higher highs and higher lows.
We can see on the one year daily chart that we do have a well-defined ascending channel, which is bullish for the stock.
Now, it just broke below the 50 day moving average. And Jason knows this. If you kind of look back in the past, the 50 day moving average is actually not that big of a indicator as far as the support or resistance level for this stock.
It's really the 200 day moving average. And it seems like we have seen a pull back here. We hit the upper end of that channel at around $313.
And it is pulling back. But if we do get to that 200 day moving average sitting in around $280, there could be some buyers that really do step in a break below that you're looking at about another $10 to the downside.
It's actually about another $5 to the downside to truly test this channel line, which is sitting around $275.
Now, our size getting close to oversold territory here, MACD and a bearer's formation 12 being able to load the 26 about to contest the zero line as well.
This one still has maybe some more room to go to the downside here, Marley. But once again, we would not be surprised at some buyer step in and around this 280 to 75 level, just given the technical structure that we've seen over the last year.
And right now we're just above that at 291 to 89. So Jason, if you were looking to trade this one, how would you approach that?
Yeah, so here's how I want to approach it. I'm looking at the January 15, 2027 280 strike price. But here's the thing is going for about $36 right now.
When you look at the delta on that option, it's a point 68, almost a point 70 delta. So if the stock falls like we believe it can about, you know, $8 to $10 more, you should be able to pick up that option for around $31.
So it's not necessarily trade. I would dive in now, unless your type of person that wants to be early, what I would do is take half the position now. And if we pull back to the 200 day moving average, which I expect, then I would add the other half of the position.
Otherwise, I would wait and do majority at a position as we get a pull back to the 200 day moving average. All right. So this one requires some patience here. You have to you have to wait a little bit and keep a close eye as we're looking at travelers. But this next one I've been talking about all week.
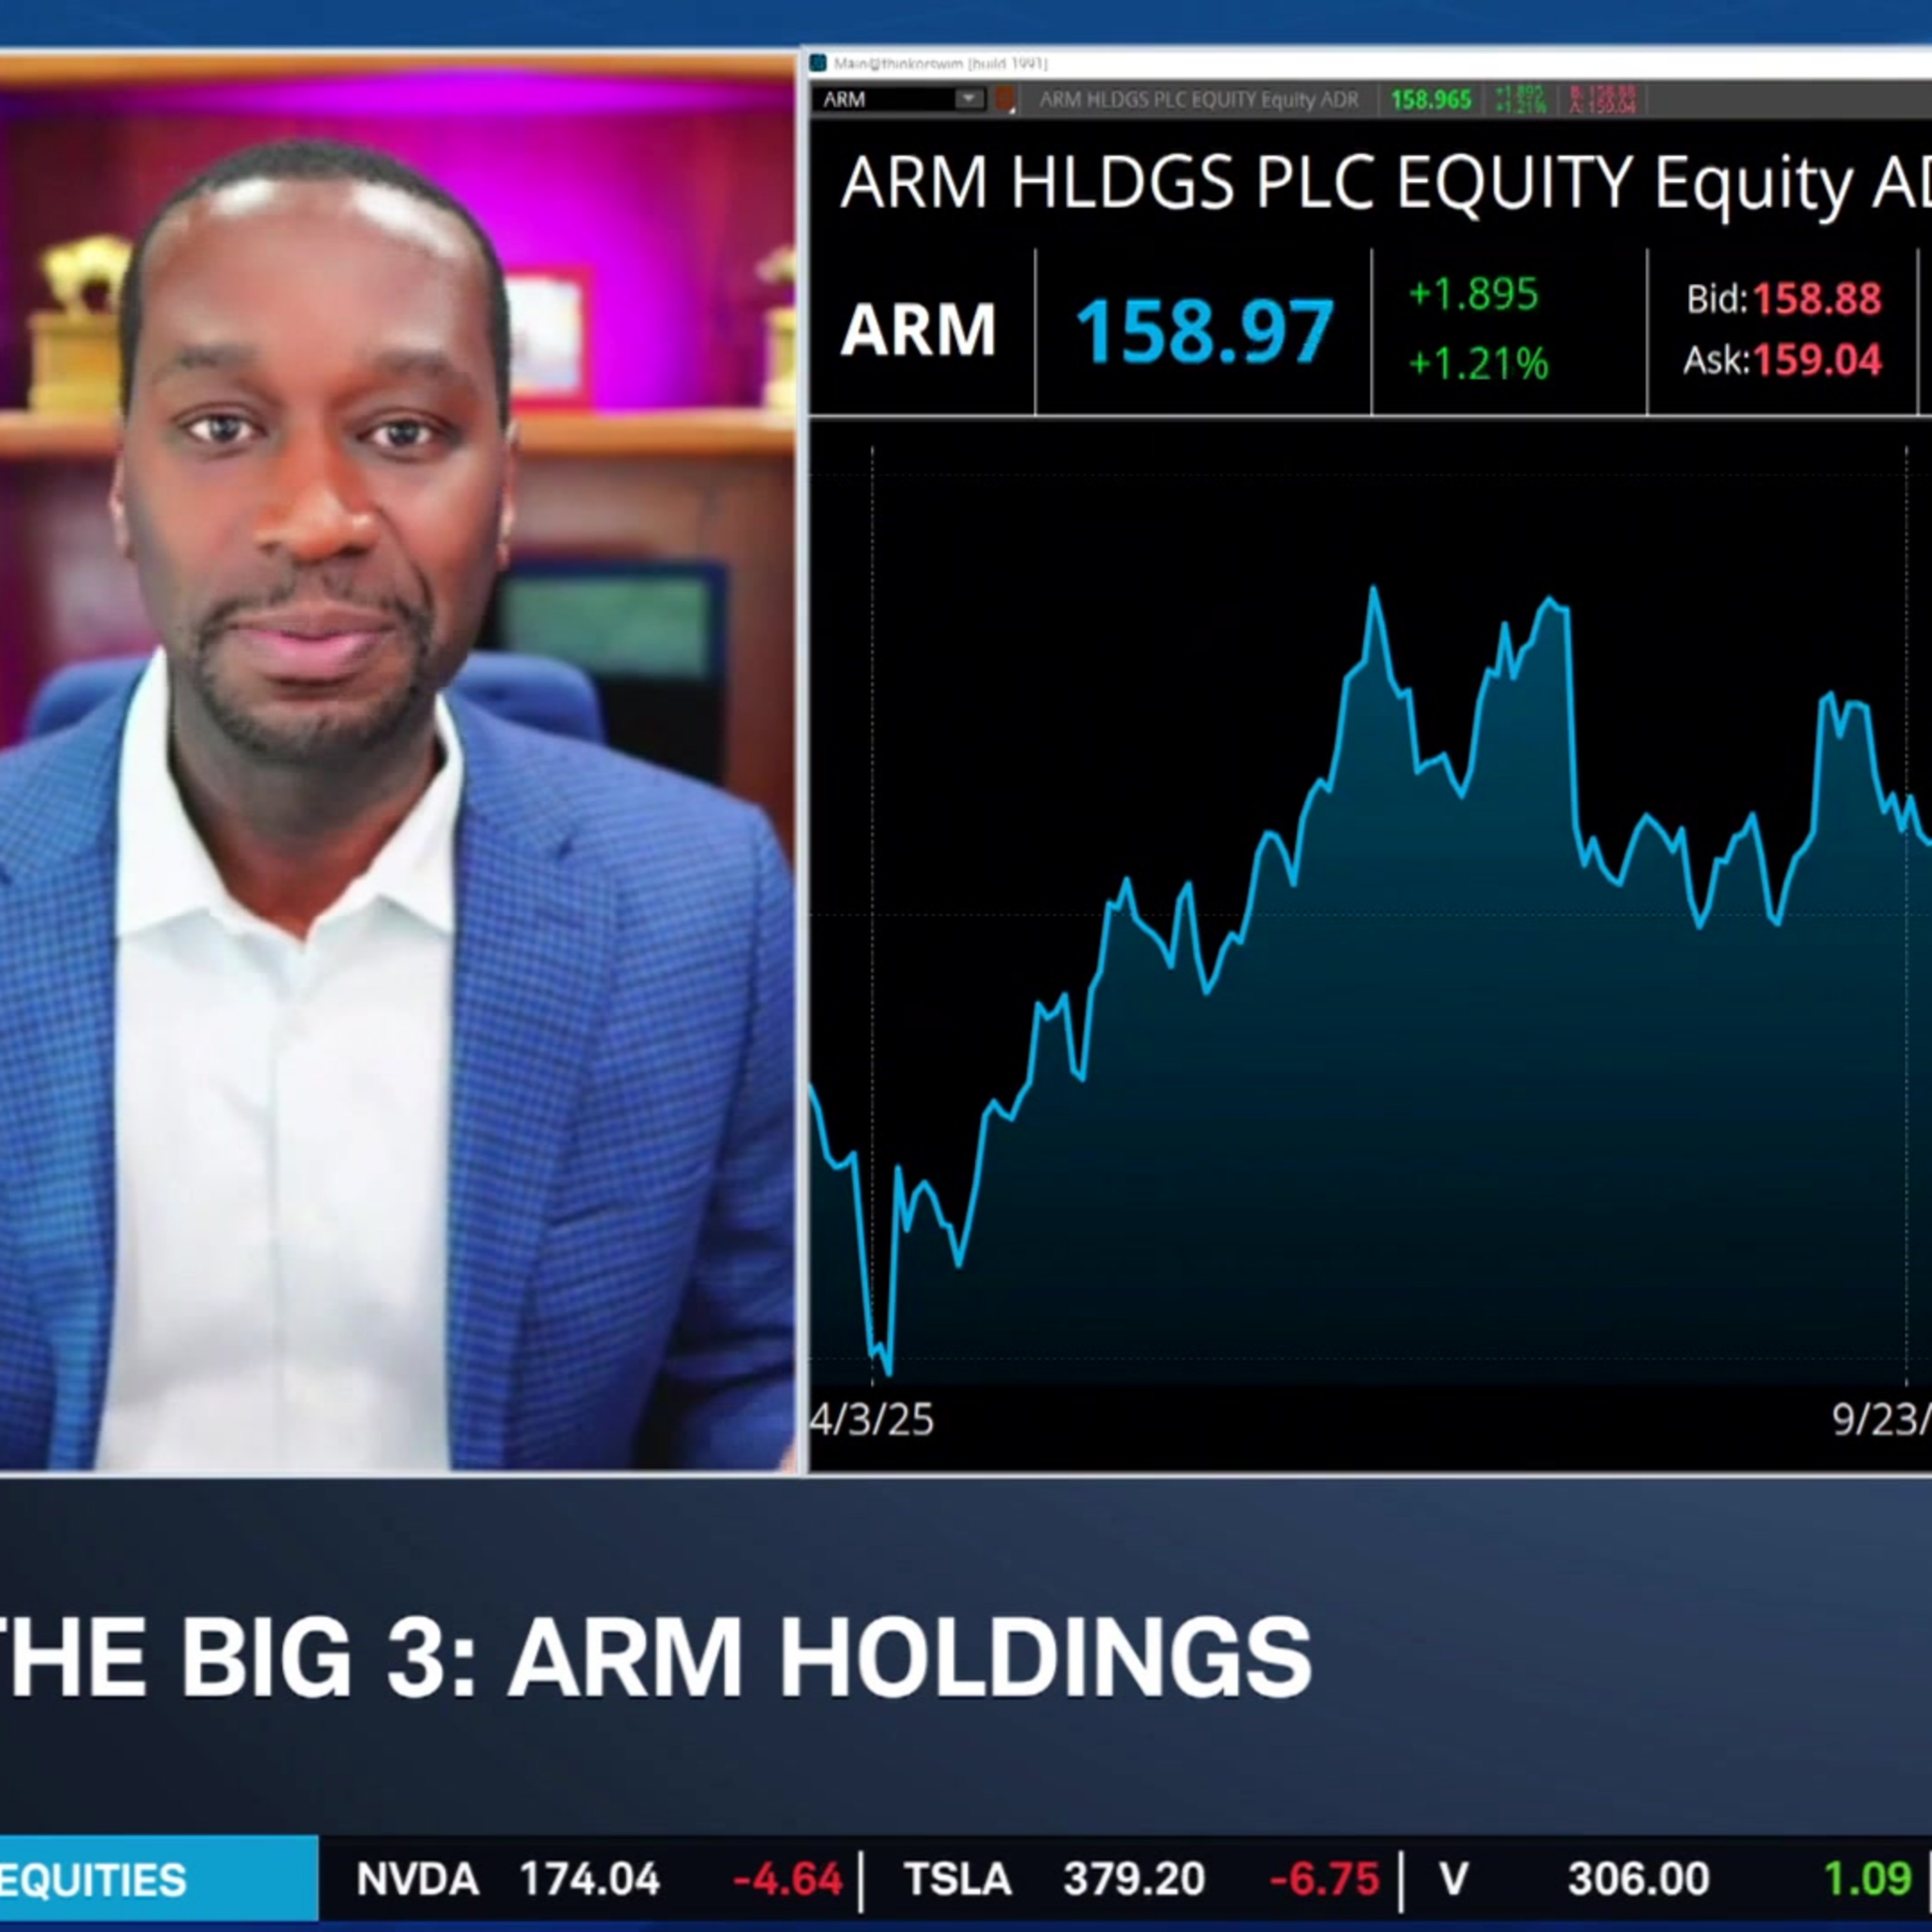
We're talking about arm holdings here. They had their, you know, big announcement. They're up 21% almost 22% so far just this month. How do you approach arm Jason?
So when I look at arm, I feel like the AI and the semiconductor and the chip space is getting really crowded. They had a big pop yesterday with the excitement that they're going to unveil their own chip and, you know, congratulations to them.
But the reality is they're now getting ready to compete with AMD, which they were already a competitor with. They're trying to compete with Nvidia. They're trying to compete with, you know, the Google's the Amazon's who's making their own chip. So I don't see that.
I saw that more as more of a news driven pop. And I don't think it's going to sustain. If you zoom out, the stock has actually been in a sideways channel. And I believe.
Well, you saw the sell off from the rally yesterday, but even if we tried to make it back towards the top, but then you're going to see some profit taking on this one.
So I'm really looking at this one as a potential bear car trade, but I'll share that after Kevin goes through the technicals. But I don't see the rally holding from yesterday. It's not holding. And then I see long term resistance as this thing has been channeling.
All right, KG, are you also seeing the rally breaking down for arm?
I would say it's a little bit mixed. I would not be surprised if we actually do go back and try to retest that $180 level here.
But what's actually very key for arm is the 200 day moving average. If you're looking at this time last year, obviously was acting as an area of resistance right around May.
We see a breakout to the upside. We came back and tried to retest it back and around July. And that's where we started to try to move higher.
And then to see a breakdown that was actually very interesting in August. We had this inverse head and shoulders pattern. Once again, breaking above the 200 day moving average breaking above the 50 day moving average coming back and retesting about a month later.
What are we setting up right now? We had a consolidation or a base that Jason called out, which rightfully so we had the 200 day moving average as an area of resistance.
We saw the breakout because of the news. You could say maybe these candles will have a pretty long wick to the upside here small body. Maybe these are going to be shooting star pattern.
But even if we do get a follow through, you could expect potentially just based on the past that it retested the 200 day moving average getting close to that could be in the cards here.
RSI is making higher highs, making higher lows when we are in overbought territory, MacDien of bullish formation 12 above the 26.
I only say the 180 is a little bit possible here though. Marley is because there's not a lot of bright areas in the market. So anytime you have a positive news catalyst that could also force flows into us particular stock.
So a little bit more bullish and bearish wouldn't be surprised to come back to that 200 day. Yeah, and we've certainly seen how powerful those headlines have been particularly this week.
But Jason, what levels are you focused on when you're looking to trade this name?
So I look at the same levels that Kevin just pointed out the 185 is setting up as resistance.
So the way I'm seeing this as a trader, I want to look at a bear cost bread because I want it. If it goes up, I want to still be right.
I just don't want it to go up too much. And so I'm going about five points outside of that 185 channel and resistance.
So I'm looking at selling the 190 for about 210 and picking up the 200 for 110. So you got $10 at risk or net $9 because you're going to bring in a dollar credit.
So you're looking at a potential 10% return for about 22 days and the stock can go up as long as it doesn't go up past that resistance.
Obviously, if it goes sideways or down, you get to keep that dollar. I like being in a position where I can win three different ways.
All right. So let's take a look at this last name. We're moving sectors completely into retail here talking about Ross.
Take us through Ross stores and why this is in your big three today.
So in this market, you really got to go shopping and you really got a dig for some interesting stocks right now because everything is either sideways or starting to go down if it's in tech.
But what's not to love about Ross as gas prices rise and inflation remains sticky. You still got to get dressed.
You still got to go to work. You still need to go out there and a discount retailer like Ross becomes a clear winner.
But more importantly, when you look at the stock, it's been in a pretty good uptrend. It's a compelling uptrend consistent touches and bounces off the 20 day moving average.
I like this one as just a simple necessity, if you will. We need to get dressed. We want to look good. You want to do it at a great price. Ross is consistently delivering.
Yeah, my last guest highlighted something similar with gas, you know, approaching $4 and food getting more and more expensive every day.
Hit a bearish call on Lulu because he says first thing that goes is $120 yoga pants. So people are going to go to Ross and get those instead.
But KG, when we look at the technicals on Ross, you know, doing well, you're to date up more than 20% sort of playing it adjacent argument. What are you seeing there?
I hate saying this here, but obviously the trend has been to the upside higher highs, higher lows, well-defined channel. We're breaking above that channel right now after consolidation and testing the 20 day moving average.
And it seems like it wants to break out higher. I'm a little bit more pessimistic regarding this name only because of two things.
You have the RSI actually making lower highs. We have had a bearish divergence showing up on the RSI since November. And once that does correct, which it will at some point in time, the pullback can be aggressive.
The other thing to call out as well as the distance between where the stock is trading at right now in the 200 day moving average.
I've gone back in the past and I have not seen this much of a differential between the two that usually doesn't last for too long.
Jason definitely has the fundamental case here and making higher highs and making higher lows hard to trade or fade that trend, but also understand that this in the stock is pretty stretched right now.
And that a rapid reaction to the downside could be in the cards and I'm looking at 195 is your first area of support.
If you continue to break up for this channel, which is channels about 25, $30 wide, you look at that breakout level about 240 to the upside is where you could probably cap out if you do get a very strong surge and volume cautious on this one.
Now once again, it's a little bit stretched given the history of this name.
All right, Jason. So with what KG just highlighted there as you're looking at Ross. Is it a short term play or long term play?
I always give myself enough time, even if I'm on it being a short term. So I'm looking at the December 18, 2026 strike price as 200, you're paying about $35 or your break even as 235.
The way I would look at this is you want to keep I'm wrong level. I like to keep I'm wrong level pretty much on all my choice, but especially one like this like KG pointed out is has been running for a while.
However, the trend is your friend. You want to stay long in the trend. You want to reward yourself for a company being earners and people shopping there. You don't want to punish it because it's doing well.
But you also want to be careful of those drawdowns because they can be pretty big. So you keep a stop underneath the 20 day moving average.
And then you just let the stock continue to run. If that's what it's going to do recently, pull it back to the 20 it bounce.
It seems to be resuming that uptrend, but you know, in this market, you never know things can reverse quickly.
So you stay long, give yourself some time, and then keep that arm wrong level and you should be fine.
All right, right now Ross trading up a quarter of a percent today. So bucking the trend of the broader market at 216.59.
I want to thank you both for being with us for big three today. Jason Brown from the Brown report.com and of course the author five year millionaire and Kevin Green for breaking down the technicals for us.
You


