Your First Interactive Plot in Python: A Hands-On Plotly Guide
About this episode
This story was originally published on HackerNoon at: https://hackernoon.com/your-first-interactive-plot-in-python-a-hands-on-plotly-guide.
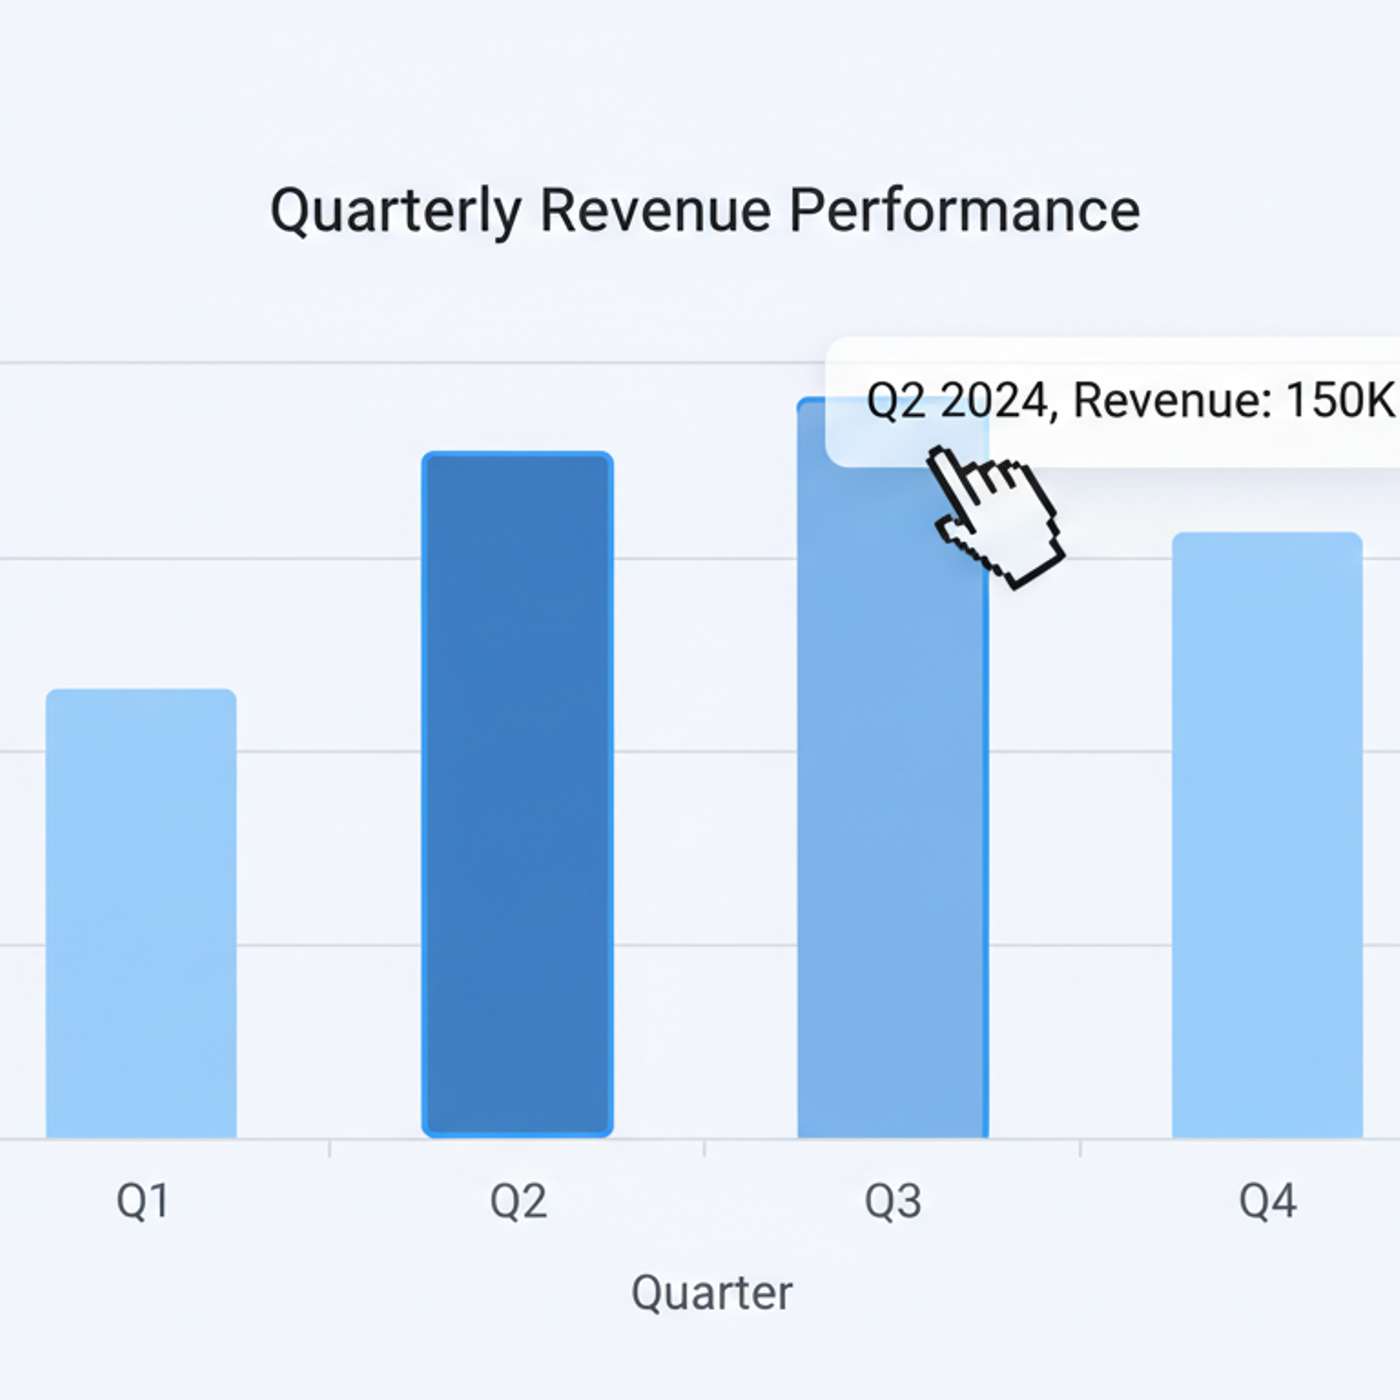
Plotly is a Python toolbox that lets you create interactive charts.
Check more stories related to programming at: https://hackernoon.com/c/programming.
You can also check exclusive content about #python, #data-science, #plotly, #charts, #matplotlib, #python-toolbox, #interactive-charts-python, #python-charts, and more.
This story was written by: @programmingcentral. Learn more about this writer by checking @programmingcentral's about page,
and for more stories, please visit hackernoon.com.
Plotly is a Python toolbox that lets you create interactive charts. The magic of Plotly lies in a fundamental change in how a visualization is created and rendered. Plotly offers two distinct but related APIs, each designed for a different stage of the analytical workflow.
Get every episode summarized
Each time Programming Tech Brief By HackerNoon publishes, we email you a written briefing from the transcript — the topics, who appeared, and any specific claims, with the ad reads skipped.
Email me new episodesFree for 3 shows. No card needed.
Hosts & guests

No transcript yet
This episode has not been transcribed. Request it and it moves to the front of the queue.
More episodes
More from Programming Tech Brief By HackerNoon

Build a Tiny Grep Clone While Rust Teaches You Who Owns What
Programming Tech Brief By HackerNoon

Deterministic Routing: The Hidden Key to Low Latency
Programming Tech Brief By HackerNoon

The Classic Computer Vision Trick Behind Smooth Image Blending
Programming Tech Brief By HackerNoon

7 Essential IP Geolocation API Features Every Developer Needs
Programming Tech Brief By HackerNoon