Chart of the Month Sep 2026 - Golden Vindication
Get every episode summarized
Each time The Contrarian Capitalist Podcast publishes, we email you a written briefing from the transcript — the topics, who appeared, and any specific claims, with the ad reads skipped.
Email me new episodesFree for 3 shows. No card needed.
About this episode
Welcome to Chart of the Month for September 2026 with The Contrarian Capitalist and Tom Bradshaw.
4 small bits of housekeeping
* This video was recorded on Tuesday 15th September 2026 PM UK Time.
* None of this is to be constituted as investment or trading advice. We are NOT financial advisors.
* Please continue to provide feedback.
* Please subscribe to The Contrarian Capitalist and Tom Bradshaw using the buttons below.
How Overvalued is Gold?
Bullet Pointed Transcript via AI (for those that don’t have time to watch the full video)
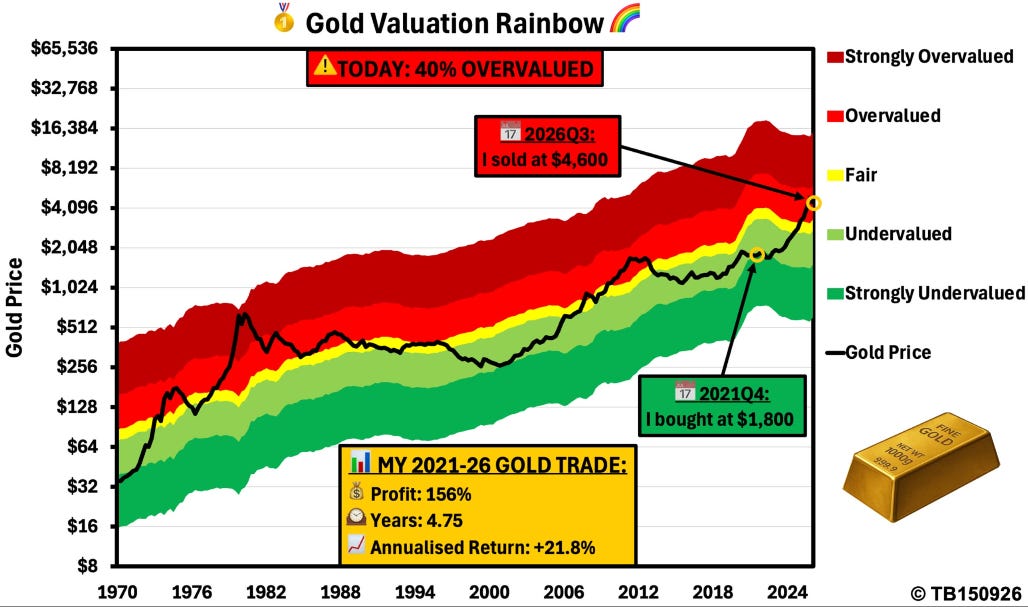
* Tom Bradshaw bought gold (via ETFs) in late 2021 near $1,800 when it was strongly undervalued (~107%), then sold at $4,600 in 2026 after momentum turned negative, for a 156% gain (~22% annualized over 4.75 years).
* He only sold paper gold/ETFs, not physical holdings.
* His model combines a long-term valuation “rainbow chart” (back to 1970) with momentum signals from multiple moving averages (mainly 6–15 months).
* Gold peaked near $5,600 in January 2026 at 71% overvalued; as of 15 September 2026 it is around $4,000 and still ~40% overvalued.
* Fair value on the model is currently about $3,000.
* The same model correctly flagged major historical lows (1970, 1976, 2000, 2009, 2015) as undervalued and major peaks (1974, 1980, 2007, 2011, 2026) as overvalued.
* Multiple independent signals (historical 45–50% declines from similar overvaluation, long-term trend line, 61.8% Fibonacci retracement, and a potential head-and-shoulders top) point to a downside target near $2,800.
* He expects a relatively short 1–2 year correction (similar to 1974–76), not a multi-year bear market, followed by another strong rally that could reach $9,000.
* Proceeds were moved into short-term U.S. 3-month Treasury bills yielding ~4% while waiting for better valuations across assets (S&P ~172% overvalued, etc.).
* The analysis is shared for educational purposes only and is not investment advice.
This is a public episode. If you'd like to discuss this with other subscribers or get access to bonus episodes, visit contrariancapitalist.substack.com/subscribe
Get every episode summarized
Each time The Contrarian Capitalist Podcast publishes, we email you a written briefing from the transcript — the topics, who appeared, and any specific claims, with the ad reads skipped.
Email me new episodesFree for 3 shows. No card needed.
Know when The Contrarian Capitalist turns up
Follow The Contrarian Capitalist and once a week we email you every new episode they appeared on — including guest spots the show notes never mention, because we read the transcript.
Follow The Contrarian CapitalistFree. Pick your own day and time.
Hosts & guests



No transcript yet
This episode has not been transcribed. Request it and it moves to the front of the queue.
More episodes
More from The Contrarian Capitalist Podcast

Dr. Carly Anderson - The Race to Power America’s Energy Future
The Contrarian Capitalist Podcast

Mid-Week Macro 16/09/2026 - Inflation pressures continue & a perfect storm is br...
The Contrarian Capitalist Podcast

Thursday Macro - Rates, Rants and Resistance
The Contrarian Capitalist Podcast

Mid-Week Macro 02/09/2026 - WTI rallies above $90, Diesel Crack above $100
The Contrarian Capitalist Podcast